Summary: Quietly buried in HMRC spreadsheets released today is the news that the UK Tax Gap – the gap between tax due and tax collected – seems consistently to be billions of pounds bigger than HMRC previously estimated. New evidence suggests that the government may be under-estimating by several billion pounds the amount of income hidden offshore, tax evasion by online retail, and non-compliance amongst the largest and wealthiest taxpayers. In these ostensible backwaters of the Tax Gap there are some very big fish.
***
Last week’s Spending Review reminded us how stretched the public finances are. This week brings a reminder of how much revenue those public finances are missing out on: the government’s annual publication of the ‘Tax Gap’. What do these new figures tell us about how the government can boost public funds by collecting more of the taxes that are due?
First of all, what is the Tax Gap?
The Tax Gap is often described as a measure of ‘tax dodging’. HMRC has a succinct and much wider definition: it is their annual estimate of
the difference between the amount of tax that should, in theory, be paid to HMRC, and what is actually paid.
That seems clear enough, though as we’ll see it includes a multitude of different sins.
And it’s worth applauding HMRC here: its Tax Gap statistics are amongst the most regular and detailed in the world. The estimation problems we discuss below are not a critique of HMRC’s unseriousness. They arise because of the sometimes vast uncertainties that are necessarily involved in trying to measure hidden aspects of the UK economy. We need more candour about those uncertainties, and open acknowledgement when new information shows a different picture.
Is the Tax Gap going up or down?
It’s certainly going up in value. Last year HMRC estimated that the Tax Gap for 2022/3 was £39.8bn, this year it estimates that for 2023/4 it’s £46.8bn.
However, the UK’s total tax liabilities are themselves going up with growth, inflation, and changes to the tax regime. At least on the face of today’s figures from HMRC, the tax gap seems to be going down as a percentage of total tax liabilities. That sounds like an HMRC win.
Buried in the spreadsheets released today, however, is a slightly different story: HMRC has revised significantly upwards the Tax Gap estimates it made for previous years. In other words, it now thinks those previous years’ estimates were significant under-estimates.
That’s a trend that we’ve noticed in successive Tax Gap publications since around 2018, but this year it’s extremely pronounced: HMRC has revised upwards last year’s Tax Gap (2022/23) by £6.6bn i.e. from 39.8bn (4.8%) to £46.4bn (5.6%). There are especially big upwards revisions of the previous estimates of missing VAT (£5 billion), and missing corporation tax of businesses both large (£0.8 billion) and small (£1.4 billion).
This makes it looks like the Tax Gap has gone down in percentage terms since last year, and only up a little in absolute terms. Whereas if you compare this years’ Tax Gap as published this year, with last year’s Tax Gap as published last year, the Tax Gap has gone up by £7 billion, and up 4.8% to 5.3% in percentage terms.
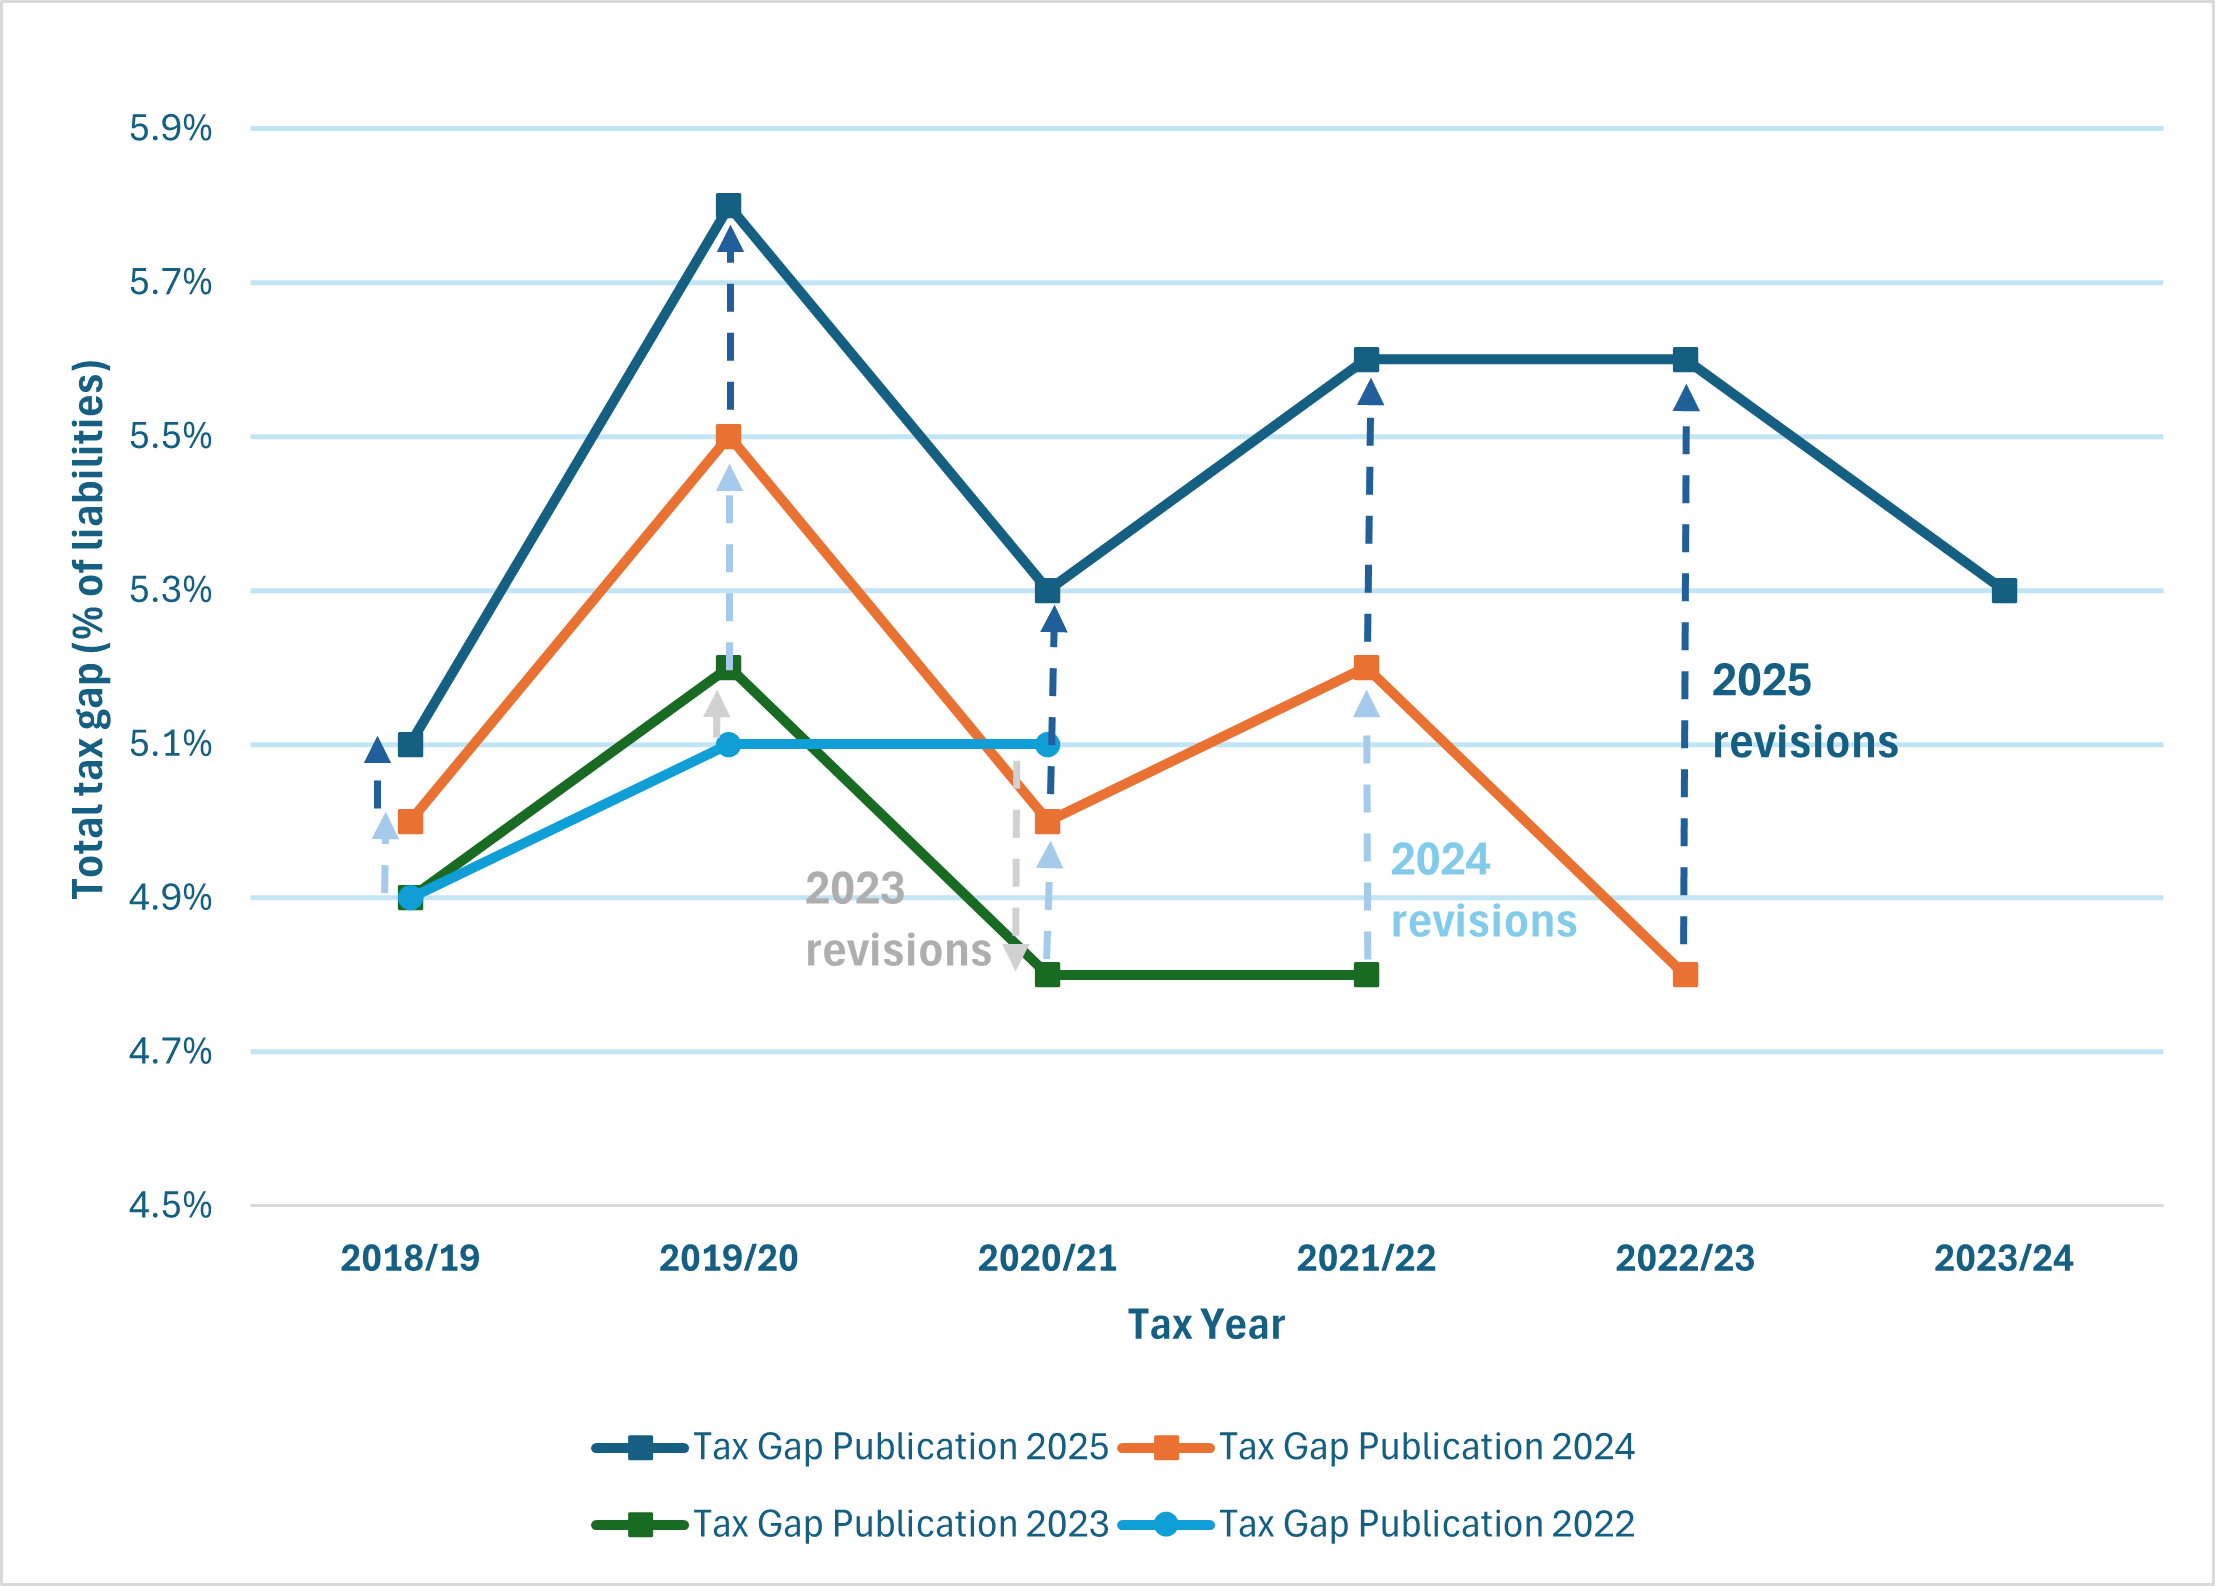
This repeated retrospective increase in the Tax Gap calls into question how seriously to take this years’ Tax Gap number as a final figure, and how much credit to give HMRC’s overarching message that all is well and the Tax Gap is stable or falling.
HMRC say there are good reasons for the revisions: for example, the tax gap is net of a forecast for the expected ‘compliance yield’ (the amount recovered by its compliance teams going after missing tax), which takes time and can differ in reality from what was originally expected. HMRC says that
Differences between the forecast yield and actual yield may lead to revised tax gap estimates in subsequent publications…The tax gap for more recent years is likely to be subject to larger revisions because a higher proportion of the compliance yield is estimated.
They also note changes in the current Tax Gap – applied retrospectively to previous years – to measuring non-payment of taxes since 2018/19; avoidance of income and capital gains taxes; and compliance yield from large businesses. But the Tax Gap’s detailed figures show that these methodology changes can’t be the whole story to explain the revisions. Here’s what it looks like for the corporation tax gap, for instance:
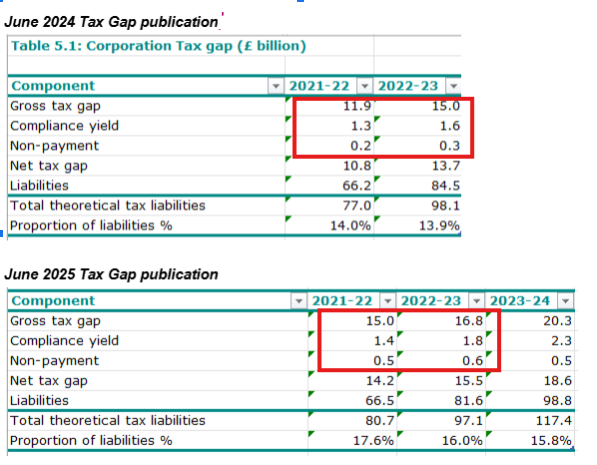
Non-payment estimates have increased a bit, but these are nearly entirely counteracted by slight increases in compliance yields (i.e. HMRC recovers more missing tax than it expected). The big change is an upwards revision by £2-3 billion in each year of the gross tax gap (i.e. missing tax), which isn’t explained by any of the main methodological changes that HMRC highlights.
What’s in the Tax Gap that might lead to such uncertainty?
The overall Tax Gap encompasses a lot of different kinds of problems and behaviours. From taxpayers making inadvertent mistakes in their tax returns; through to attempts to manipulate gaps or inconsistencies in law to reduce a tax bill; all the way to deliberately hiding income or transactions from HMRC – by smuggling goods, getting paid in undeclared cash or crypto, accruing income and gains in undeclared overseas accounts, and so on.
Some of these categories are much easier to measure than others. Errors on tax returns get picked up by audits of a selection of returns, corrected, and can then be scaled up to an estimate of their scale and frequency. By contrast, interest earned on a pile of money deposited in an offshore bank account, owned by an anonymous trust that HMRC can’t see, is just that: it’s invisible. Meaning that such tactics (which form part of the ‘self-assessment’ and ‘hidden economy’ categories in the Tax Gap) are hard to quantify in the same ‘bottom-up’ way except through those occasions, of uncertain frequency, when HMRC does uncover undisclosed offshore money.
To its credit, HMRC acknowledges these differing estimation problems. Deep in a methodological annex, it awards an ‘uncertainty rating’ to 24 of the 33 different components of the tax gap: 15 of these 24 components are rated as ‘high’ (9) or ‘very high’ (6) uncertainty.1 (It’s worth underlining what HMRC means by ‘very high uncertainty’ here: it means that the figure is based on a model in which “almost all the tax base and population are missing and almost no risks are being accounted for“, or an “assumption based sensitive model, most of which are unverifiable.“)
But these high levels of uncertainty don’t feed through to how the Tax Gap is presented or communicated: without error bars, and giving the overwhelming impression that after some years of work on tax evasion and aggressive avoidance schemes, the remaining big ticket items are the less dramatic areas of errors, carelessness, and small business non-compliance.
So should these areas be HMRC’s focus, rather than going after the tax affairs of the wealthy and big business, or digging around in tax havens for hidden income?
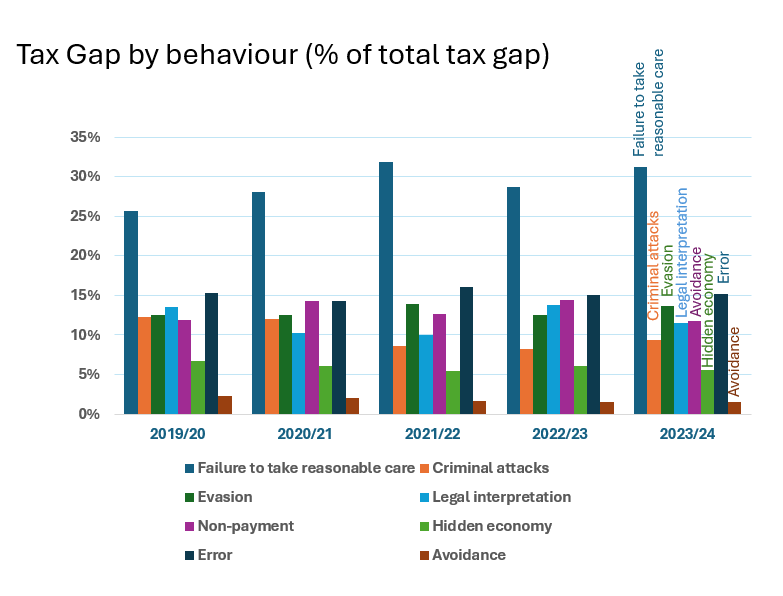
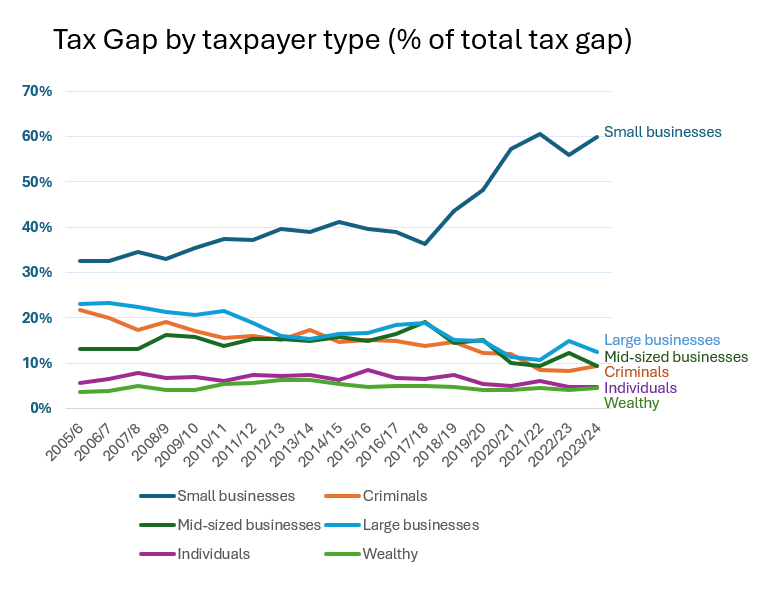
According to today’s figures, the biggest categories of revenue losses within the Tax Gap are not from tax avoidance and evasion, but from carelessness and error, making up 46% of the total figure. Likewise the taxpayers responsible for most of today’s Tax Gap figures are small businesses, which HMRC says now account for 60% of the Tax Gap.
It would obviously be absurd to ignore the scale of revenue loss from errors and carelessness. It’s an area that’s relatively well-measured, and in theory there’s £21.7 billion of missing tax revenue at stake. (While the Chancellor has promised HMRC an additional 5,500 new compliance staff by 2029 to chase missing tax, much of the work to tackle errors and carelessness happens instead through customer service interactions. These are done by HMRC departments that have not been promised new staff – and with only 1.7% annual growth in HMRC’s day-to-day resources, they could even see cuts given the need to accommodate the public-sector pay deals and the new compliance/debt staff).
Likewise the fact that 37 percent of small businesses’ corporation tax returns apparently have significant errors – larger than £1000 of extra tax liability – shows the potential revenue gains from getting their tax returns right. (Some of the small business gap will come from deliberate avoidance or evasion; some from misadministration – the ballooning of spurious claims for R&D credits in recent years, for instance; some from error).
In short: there are billions of pounds to be recovered through the hard and prosaic work of getting smaller taxpayers’ tax bills right.
Serious underestimates
However: what gets measured gets done. The problem with simply comparing these categories within the Tax Gap, and allocating more resources to the bigger ones, is that their uncertainty is very unevenly distributed. There could be real revenue potential in tackling seriously under-estimated parts of the Tax Gap.
And over the last six months a growing body of evidence has been accumulating that some of the ostensibly smaller but more uncertain tax gaps may indeed be serious underestimates: typically those categories involving small numbers of very wealthy or profitable taxpayers.
1. According to a May 2025 National Audit Office report, HMRC compliance teams obtained £5.2bn of unpaid taxes in 2023/4 from ‘wealthy taxpayers’. Yet HMRC’s Tax Gap estimate for tax going unpaid by these wealthy individuals annually has been around £3 billion less than this since 2020. As the NAO pointed out, either wealthy individuals have become much less compliant, but HMRC “has then been successful in tackling the increase in non-compliance through its compliance activity, such that the amount of non-compliance it is unable to stop has remained the same” (such a large behaviour change amongst wealthy individuals is highly unlikely); or levels of tax non-compliance among wealthy individuals are much greater than HMRC’s estimates.
2. There’s a similar story with tax evasion through income, gains and assets hidden offshore (part of the ‘self-assessment’ and ‘hidden economy’ categories of the Tax Gap’). HMRC’s estimation of offshore tax evasion rests on an experimental estimate, first published in October 2024, which only covered the 2018–19 tax year, and only encompassed a single narrow class of income — interest, dividends, and capital gains accruing in foreign bank accounts directly owned by individuals identifiable as UK self-assessment taxpayers. Moreover, it only includes accounts in jurisdictions that automatically exchanged information with the UK that year. It does not cover taxable income arising in trust structures, corporate entities, indirect ownership, or undeclared business income — all key vehicles for offshore tax abuse. Nor does it account for jurisdictions that may have failed to report accurately or completely. At just £300 million, this figure looks very unimpressive.
3. Some other kinds of offshore tax evasion – inheritance tax due from non-UK trusts, for instance – may be included in other parts of the Tax Gap, but it’s not clear to what extent. In May 2025 the National Audit Office, commenting on HMRC’s new £300m ‘offshore account tax gap’ figure, reported that “Internally, HMRC has identified a much larger amount of tax at risk from all forms of offshore non-compliance, but it does not publish this figure.” It isn’t clear whether any of these are included in the Tax Gap, though since the published Tax Gap’s ‘development priorities‘ include “Assess[ing] the feasibility of extending the published estimate of the tax gap arising from undisclosed foreign income“, it seems likely that they are not.
4. Evasion of VAT and import duties by overseas online sellers is another big problem. In January 2021 the government introduced legislation making online marketplaces liable for the VAT from overseas sellers. This brought in £1.5 billion of additional tax a year. Once again, a familiar pattern of under-estimation: £1.5 billion of previously evaded tax was five times greater than HMRC had estimated at the time. As Parliament’s Public Accounts Committee pointed out, this indicates that HMRC had seriously underestimated the scale of evasion. (In response, HMRC claimed that this dramatic increase was due in part to the post-Covid increase in online retail. That can’t really be a full explanation, though: the ONS’ retail sales index for Internet Sales shows that internet sales have increased in the long run by about 40% since Jan 2019, not 500 percent).
These four multi-billion-pound omissions and underestimates are not HMRC’s fault, and they’re open about the limitations of such figures. Nonetheless, combined with the year-on-year revelations that previous Tax Gaps have been multi-billion pound under-estimates, it’s time we were more transparent regarding what we do and don’t know about the UK’s missing tax revenues.
We shouldn’t overplay the goodies for the public purse that might be found offshore and in the complex structures of the super-rich. But this new information about underestimates suggests that the ostensible backwaters of the Tax Gap still contain some very big fish. Large compliance cases can be enormously efficient uses of resources. Every pound that HMRC spent last year ensuring companies and individuals pay their taxes generated £17.45 in due taxes collected or protected. For spending on large companies’ tax compliance, that figure rose to £46.33. Last month the National Audit Office revealed that just one wealthy taxpayer pursued by HMRC’s wealthy compliance team netted £2.5 billion of previously missing tax over 2022-24. That’s larger than the entirety of what HMRC estimates to be the wealthy individuals’ annual Tax Gap (£2.1 billion) – just for one wealthy individual. (To put it into perspective, £2.5 billion is larger than the overspend by all NHS provider trusts in those years).
Ironically, the possibility that offshore evasion and wealthy tax non-compliance are under-estimated actually supports the government’s decision to boost HMRC compliance staff and resources in these areas, suggesting that the government too may consider in private that these areas could be under-estimated.
Fair and effective
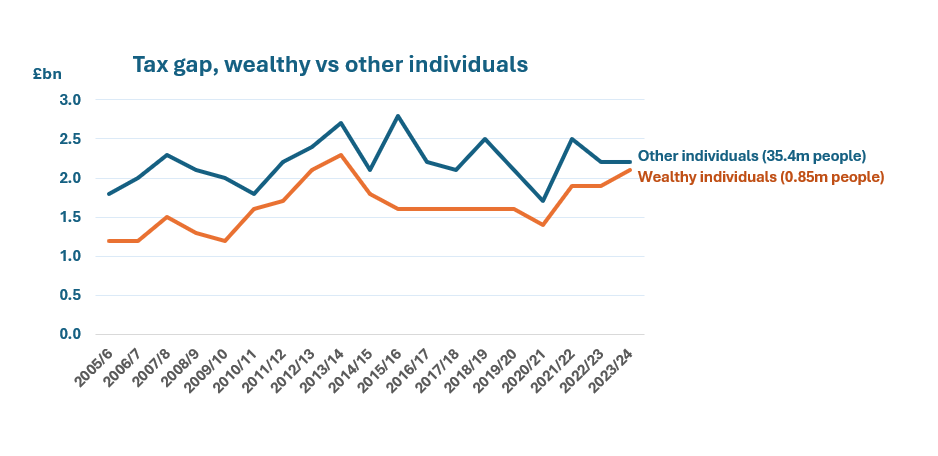
And finally, ensuring the compliance of large and wealthy taxpayers is also a question of fairness. Today’s figures show that the estimated tax gap for ‘wealthy taxpayers’ – about 850,000 people with incomes over £200,000 or assets of over £2 million in any of the last three years – is roughly the same as the tax gap for all other individual taxpayers combined (around 35.4 million people). The difference between the missing tax of the two groups is narrowing – even before we consider that the wealthy tax gap is itself, as we’ve seen, likely a significant underestimate.
Neglecting these large if complex cases of tax non-compliance would be a false economy – but also seriously unfair.
***
[1] HMRC argues that the ‘high’ and ‘very high’ uncertainty categories only cover 21 percent of the Tax Gap *by value*. But if those very uncertain categories are actually significantly under-estimated, then the percentage of the total Tax Gap that they represent could be much greater.
***
Main image: James Hulme/Flickr CC BY 2.0